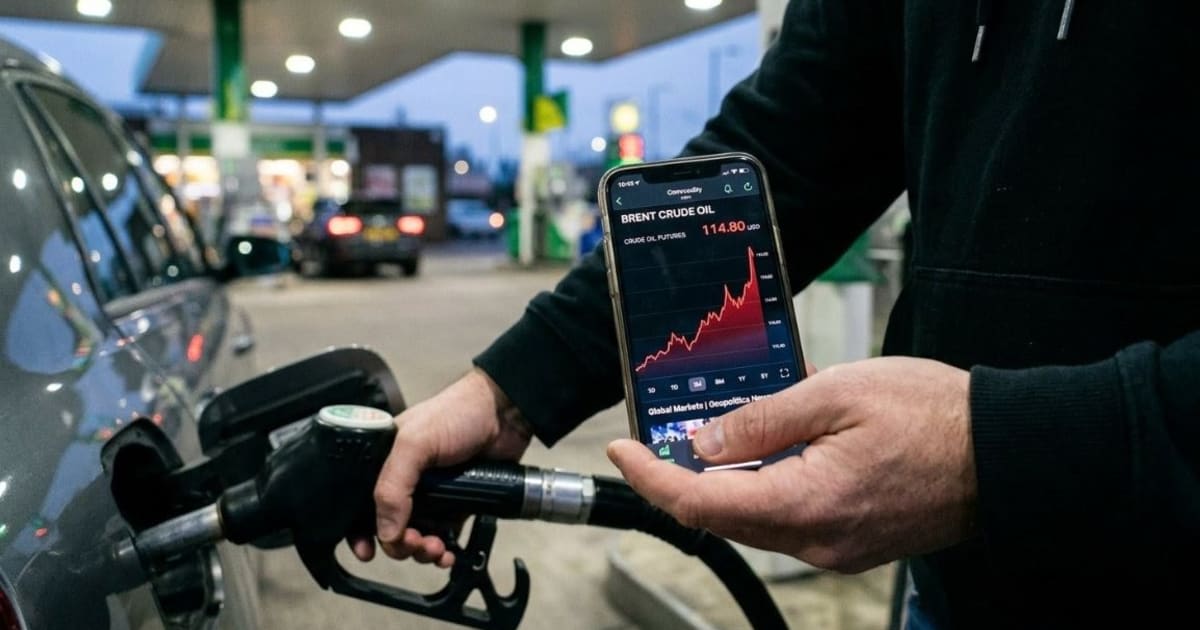
Oil crossed $114 a barrel this week. Not because of a supply outage. Not because a refinery blew up or a tanker ran aground in the Gulf. Because Donald Trump made a speech — and traders decided the probability of something going very wrong in the Middle East just got meaningfully higher.
That distinction matters. A lot.
For drivers filling up in the US right now, $114-115 Brent translates to roughly $4.30-4.50 per gallon at the pump, depending on your state. In the UK, that's approximately 142-148 pence per litre, up from around 138p just three weeks ago — adding roughly £8-12 to a typical tank fill. In India, where retail prices are administratively set and revised with a delay, the hit arrives in stages: expect ₹103-108 per litre at Indian Oil forecourts within the month if crude holds these levels, compared to ₹95-97 earlier in the year. Whether you're filling up in Houston, Birmingham, or Bengaluru, the direction is the same.
The markets moved before most people woke up Monday. Asian equities fell overnight. European and US futures pointed lower ahead of the open. The S&P 500, FTSE 100, and Nifty 50 are all now pricing in a world where oil stays expensive and geopolitical risk stays unresolved. The question — the only question worth asking — is how long this lasts, and what it costs you personally while it does.
The Core Problem
The $115 threshold matters for a specific structural reason: it is not just a price, it is an inflection point where the macroeconomic math changes. When crude trades above $110 for more than two consecutive weeks, airline hedging programs get stressed, trucking operators begin applying fuel surcharges to freight contracts, and central banks — already monitoring core inflation carefully — are forced to calculate whether energy cost pass-through demands another rate decision. At $115, no central bank governor in London, Frankfurt, or Washington can credibly label this 'transitory.'
Trump's remarks landed at the worst possible moment for energy markets. Crude had been tightening already. OPEC+ had maintained its production discipline intact through all of Q1 2026, refusing to open the supply taps despite repeated pressure from Washington. The Brent forward curve had moved into backwardation — meaning physical buyers were willing to pay a premium for oil delivered today versus future delivery — which is a technical signal of genuine real-world supply tightness rather than financial speculation.
The EU's exposure here is particularly sharp. Europe imports roughly 55-60% of its crude from outside the bloc. Since the Russia sanctions forced a wholesale rerouting of European energy supply chains in 2022-2023, European refiners have built their logistics around Middle Eastern, West African, and American crude. A sustained conflict that threatens Strait of Hormuz passage — even partially — disrupts approximately 20-21 million barrels per day of global oil flow. That is roughly one fifth of total global daily consumption passing through a chokepoint 34 miles wide at its narrowest point.
The practical cost for a British household running a diesel car: roughly £25-35 more per month if oil settles at $115 for six weeks. For a German family on an energy-indexed heating contract, the next quarterly bill revision could add €60-80. For an Indian household, where LPG cylinder prices are subsidized by the government in the short term, the state absorbs the pain upfront — but that subsidy burden eventually feeds into fiscal deficits, which feeds into the rupee exchange rate, which feeds into the cost of everything imported, from electronics to edible oil.
There is a second-order effect that almost no mainstream coverage is addressing. At $115 oil, jet fuel pricing — which follows crude with roughly a 10-14 day lag — moves toward levels that force airlines to reinstate fuel surcharges. European carriers including Lufthansa and British Airways hold hedging programs that insulate them for six to nine months at a time, but those hedges were priced at pre-2026 levels. When hedges roll over in Q3 2026, airfares go up. Your summer flight to Lisbon or transatlantic business upgrade? Budget an additional $80-120 per ticket if crude holds where it is.
The geopolitical mechanism driving this is also worth dissecting carefully. Trump's statements were not just political noise — they moved futures markets because they introduced a calculable probability shift. Traders are not pricing in a conflict starting tomorrow. They are pricing in a world where the probability of a confrontation that disrupts Gulf production has risen from roughly 5% to somewhere between 12-15%. Options markets, which capture volatility expectations rather than directional bets, saw a sharp spike in crude vol — the precise technical signal that institutional money is hedging against an upside oil scenario rather than speculatively betting on one. That is a meaningful distinction. Hedging is defensive. It suggests big money believes the risk is real enough to insure against.
Historical Parallel
The last time oil moved this fast on a single political statement was September 2019, when Houthi drone strikes hit Saudi Aramco's Abqaiq processing facility and briefly knocked out 5.7 million barrels per day of production — roughly 5% of global supply. Brent surged close to 15% in a single session, from around $60 to $71. The spike lasted approximately three weeks before partial production restoration and Saudi reassurances calmed the market down.
That 2019 episode is instructive specifically because of what happened afterward: nothing catastrophic. Supply came back online. Prices normalized within a month. Traders who bought oil on the spike crystallized losses on the unwind. A clean cautionary tale about geopolitical premium overshooting.
But there is a critical structural difference between 2019 and now. In 2019, the global oil system had shock absorbers. US shale production was growing at approximately 1.5 million barrels per day annually, adding meaningful supply each quarter. OPEC+ held theoretical spare capacity of 3-4 million barrels per day that could be deployed in a genuine emergency. Saudi Arabia alone was sitting on significant idle capacity. The system could absorb a shock.
In 2026, those absorbers are considerably thinner. US shale growth has plateaued — the highest-productivity Permian Basin acreage is largely committed, and new well productivity has declined measurably from peak levels as the best rock gets drilled first. OPEC+ spare capacity is estimated closer to 1.5-2 million barrels per day, concentrated in Saudi Arabia and the UAE, and both have demonstrated consistent reluctance to deploy it without what they classify as a genuine supply emergency rather than a price management request from Washington.
Go back further to 1973 and the parallel gets darker. When OPEC members embargoed the US and Netherlands, crude prices quadrupled from roughly $3 per barrel to $12 within months. That shock triggered recessions across Western economies, forced the UK into a three-day working week to conserve energy, and ignited the inflation cycle that defined the rest of the 1970s. Adjusted to today's consumption volumes, a similarly proportional supply shock would represent trillions of dollars in lost global economic output.
We are not there yet — and the scale of that comparison should not be overstated. But the trajectory matters more than the absolute level. At $115 today, economies can manage with pain. At $130 with no visible de-escalation path, central banks face a genuine dilemma: tighten rates to contain energy-driven inflation and risk pushing economies into recession, or hold rates and allow inflation expectations to drift upward and become self-fulfilling. For the approximately 1.2 million UK households on variable-rate mortgages, that policy dilemma lands directly on their monthly bank statement. The difference between a Bank of England hold and a 25 basis point hike translates to roughly £45-60 more per month on a £250,000 mortgage.
The Data Under the Hood
Here is what the headline price alone does not show you. Brent at $115 is notable. The more revealing data point is the shape of the 12-month forward curve. As of late March 2026, the Brent curve sat in steep backwardation — December 2026 futures were trading at approximately $108 while spot price exceeded $114. Steep backwardation is not a financial artifact. It means physical buyers — refiners, airlines, shipping companies running actual operations — are willing to pay a premium for oil in hand today over oil promised for future delivery. That is a real-world supply signal, not a speculative one.
The positioning data adds a second layer most analysis misses. CFTC data shows money managers — hedge funds and commodity trading advisors — increased their net long positions in Brent and WTI futures to the highest concentration since mid-2022 in the weeks before this spike. Long-heavy positioning does not create the fundamental move, but it amplifies it dramatically. When large institutional money concentrates on one side of a trade and geopolitical news confirms their thesis, the move accelerates beyond what fundamentals alone would justify. Those positioning stacks also unwind fast — and when they do, the drop is as sharp as the climb was.
EU natural gas storage data, while technically separate from crude oil pricing, provides critical context that energy-market observers are watching closely alongside crude. European gas storage entered Q2 2026 at approximately 35% of capacity — below the five-year seasonal average of 42% for this time of year. That is not a crisis level on its own. But it means Europe has less of a cushion than usual heading into the spring refill season. If Middle Eastern tensions simultaneously affect LNG shipping routes or spot LNG pricing — and Qatar, the world's largest LNG exporter by volume, sits directly in the Arabian Gulf — European energy costs receive a second distinct hit, entirely separate from crude oil dynamics.
For India, the import bill arithmetic is unambiguous. India sources approximately 85% of its crude requirements from abroad. At $115 per barrel, India's monthly crude import bill runs roughly $14-15 billion. At $80 per barrel — the level that prevailed for much of 2025 — that bill was $10-11 billion. The $4-5 billion monthly difference is not abstract: it roughly equals India's entire monthly software export revenue. The rupee weakens when the import bill balloons in this way, and a weaker rupee raises the cost of every imported good in local currency terms — electronics, fertilizers, edible oils, industrial components. Your ₹105/litre fuel price is only the most visible symptom.
The S&P 500 correlation with oil is nonlinear, and this is where quick-take analysis often gets it wrong. Below around $90 per barrel, rising oil is mildly positive for equities — energy sector earnings improve, and elevated prices signal underlying demand strength. Between $90 and $110, the relationship turns neutral to slightly negative as cost pressures begin showing up in corporate margins. Above $110, the correlation flips clearly negative: energy costs become simultaneous headwinds for airlines, shipping companies, manufacturers, and consumer discretionary retailers. At $115, you are squarely in negative territory for broad indices. The FTSE 100 shows a more complex picture — BP and Shell together represent roughly 12-13% of the index, so energy stocks pull one direction while the rest of the index pulls the other. Nifty 50 faces unambiguous pressure: India imports rather than exports energy, and oil above $110 historically correlates with Nifty underperformance relative to global emerging-market peers by 4-6 percentage points over six-month periods.
Two Sides of the Coin
The bull case for oil — meaning the argument that prices stay elevated or grind higher from here — rests on three pillars that are genuinely difficult to dismiss.
First, OPEC+ discipline has proved more durable than almost any 2024-era forecast predicted. The coalition's agreement to restrain production, extended repeatedly through 2025 and into 2026, has kept supply off the market through two years of political pressure, defection temptation, and direct lobbying from Washington to open the taps. Saudi Arabia, which needs oil prices somewhere above $80-85 to fund its Vision 2030 infrastructure and fiscal commitments, has no rational interest in flooding the market. The UAE has been similarly aligned. Without a major OPEC+ production reversal — which would require either a price collapse or a political rupture within the group — the supply side remains structurally tight.
Second, global oil demand has not buckled under sustained elevated prices the way demand-destruction models projected. Electric vehicle adoption is accelerating, but it has replaced only a fraction of global transportation fuel demand to date. Aviation recovered faster and more completely than virtually any 2020-era projection suggested, with international seat capacity now exceeding pre-COVID levels in most regions. Industrial and residential demand from emerging markets — India, Southeast Asia, Sub-Saharan Africa — continues to grow. IEA demand projections for 2026, revised upward twice in the past twelve months, now sit above 103 million barrels per day. That is a big number for a tight system to accommodate.
Third, geopolitical risk premium, once embedded in oil pricing, has historically proved persistent. Once physical buyers and financial traders begin modeling conflict scenarios and adjusting procurement accordingly, the premium does not evaporate on a single diplomatic statement. It fades gradually over weeks as evidence of de-escalation accumulates.
The bear case is equally coherent — and in one specific way, more interesting.
The core bear argument is that demand destruction happens faster than bulls expect at sustained $115-plus prices. US gasoline demand data already showed a modest but measurable decline when prices briefly spiked above $105 in Q4 2025. European households, still carrying behavioral scars from the 2022-2023 energy crisis, tend to respond to high energy prices by aggressively reducing consumption — driving less, adjusting thermostats, deferring discretionary travel. If global demand rolls over by even 500,000-800,000 barrels per day from current levels, the supply tightness that is currently supporting prices begins to dissolve.
The bear case also leans on a Trump-specific dynamic that the market cannot fully price: the same administration that stoked geopolitical fears with aggressive rhetoric has a documented history of walking back positions when market volatility becomes politically inconvenient. A single de-escalatory statement, a phone call, a joint communiqué — and the $8-12 geopolitical premium built into current prices could unwind in a session. Traders who bought the spike become motivated sellers. The positioning unwind does the rest. The speed of the drop in that scenario would match the speed of the climb.
Scenarios & What-Ifs
Three scenarios, framed by probability as of March 30, 2026.
Scenario one: De-escalation within 30 days. Probability: roughly 35%. Trump's rhetoric softens following diplomatic engagement, or a credible ceasefire agreement reduces the perceived threat to Gulf production. Brent retreats toward the $95-100 range over four to six weeks as geopolitical premium unwinds in stages. Stock markets recover. For households, this is the relief scenario — pump prices stabilize at uncomfortable but manageable levels, airline surcharge reinstatements get shelved, and central banks retain the breathing room to avoid emergency rate decisions. Your fuel bill stays elevated but stops climbing.
Scenario two: Sustained tension, no direct conflict. Probability: roughly 45%. This is the most consequential scenario for household budgets because it is the hardest to plan around. Oil anchors in the $105-120 range for two to three months. Energy companies accumulate windfall profits. Consumers absorb sustained pressure — average US household gasoline spending climbs toward $300 per month, up from roughly $220 a month in early 2025. In Europe, energy-indexed household bills revise upward at the next quarterly adjustment cycle. In India, the government delays retail pump price revision as long as politically viable, then applies a ₹5-8 per litre increase in a single move. This is gradual enough to avoid triggering a technical recession in most economies, but persistent enough to slow consumer spending, squeeze corporate margins, and complicate every central bank's rate path through year-end.
Scenario three: Escalation and physical supply disruption. Probability: roughly 20%. A direct confrontation threatens Hormuz passage or major Gulf production facilities. Brent tests $130-140. Central banks face the stagflation scenario they most feared — rising energy prices forcing higher rates into a slowing economy. The S&P 500 could shed 10-15% from current levels in a sharp de-risking episode. For households globally, this is the scenario where fuel, food (which depends on diesel-powered agriculture and refrigerated freight), and imported goods all get more expensive simultaneously.
Oil moves fast at $115. The question Trump opened — and the market has taken seriously enough to reprice an entire asset class around — is whether the current level is a ceiling or a floor.
💰 What this means for your money: For the average household, this means $25-35/£20-28/₹2,100-2,900 more per month on fuel and energy.
"At $115, no central bank can call this transitory — and every household feels why."
The Bottom Line
Oil at $115 on a political speech — not a supply shock, not a hurricane, a speech — tells you everything about how thin the system's buffers are right now. The geopolitical premium is real, the positioning is crowded, and the second-order costs on airfares, groceries, and heating bills are coming whether or not the headlines stay loud. The move was fast. Whether it was justified is a question we'll be answering long after the speech cycle moves on.
Frequently Asked Questions
Why did oil prices jump to $115 because of what Trump said?
Trump's statements raised the perceived probability of a military confrontation in the Middle East — a region responsible for roughly 35-40% of globally traded crude oil. Markets don't need a conflict to happen; they price in the probability of one. When that probability rises from around 5% to 12-15%, traders and physical buyers adjust positions immediately, and $8-12 gets added to the price as a risk premium.
How does $115 oil actually affect my grocery and fuel bills?
At $115 Brent, US drivers face roughly $4.30-4.50 per gallon at the pump. UK drivers pay approximately 142-148p per litre. In India, expect ₹103-108 per litre within weeks. Beyond fuel, diesel powers agriculture and freight — so grocery prices follow crude with a 4-6 week lag. A family spending $250/month on fuel could see that rise toward $290-310 if prices hold.
What should I watch to know if this gets worse or better?
Watch the Brent 12-month forward curve: if backwardation deepens (spot price well above futures), tightness is real. Watch CFTC positioning data weekly — if net longs keep growing, the move has momentum. The most important near-term trigger is any formal diplomatic statement from the US State Department or Gulf governments; a credible de-escalation signal could unwind $8-10 in a single session.