The Morning the Numbers Stopped Making Sense
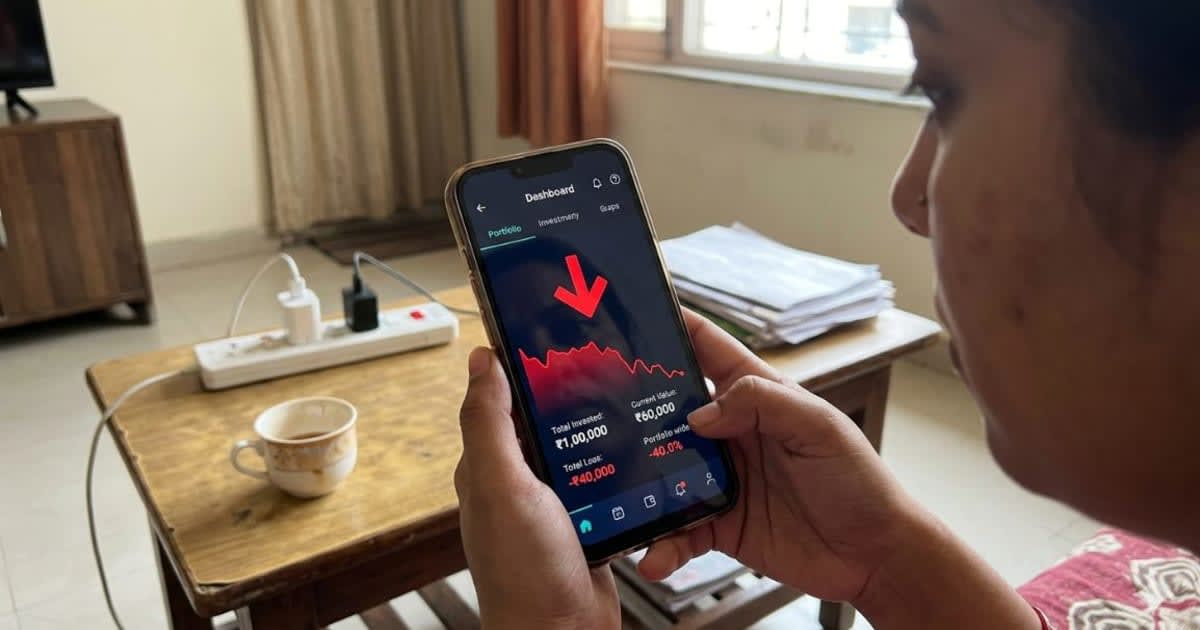
Priya Nair, a 34-year-old HR manager in Pune, opened her Zerodha app on a Tuesday morning expecting the usual dull fluctuations. What she saw made her put her coffee down. Her large-cap mutual fund — the 'safe' one, the one her relationship manager called 'blue-chip stable' — was showing a return of negative 22% for the calendar year. She'd been putting in ₹15,000 a month since January. On paper, she'd lost over ₹28,000. Not on a small-cap punt. On the supposedly boring part of her portfolio.
Priya isn't an outlier. She's the market's median story right now.
What's Actually Happening Out There
The BSE Sensex has shed roughly 12.5% in CY26 — that's about 9,500 points wiped from the index since January 1. But the headline number undersells the pain. Embedded inside that fall are 15 large-cap names that have individually collapsed between 25% and 40% in just five months.
These aren't micro-caps with shady promoters or penny stocks someone forwarded on WhatsApp. These are companies with market caps in the tens of thousands of crores. They appear in your Nifty 50 or Nifty 100 fund. They're in your flexi-cap. They're likely in your ELSS.
The forces driving this aren't mysterious:
- FII selling has been relentless. Foreign institutional investors have pulled out capital steadily through CY26, rotating toward US dollar assets and emerging markets perceived as cheaper.
- Global uncertainty — rate trajectories in the US, geopolitical friction, and commodity price volatility — has made risk appetite thin.
- Earnings disappointments in select sectors have stripped away the valuation premium Indian large-caps enjoyed post-2023.
- Domestic retail flows via SIPs have cushioned the fall partially, but not enough to absorb institutional exits at this scale.
What This Means for Your Actual Rupees
Here's where your money sits in this story. Let's be precise about it.
If you've been running a ₹10,000/month SIP in a large-cap or flexi-cap fund with meaningful exposure to these 15 names, your corpus since January looks roughly like this:
| Monthly SIP | Invested in CY26 (5 months) | Approx. Current Value | Notional Loss |
|---|---|---|---|
| ₹5,000 | ₹25,000 | ₹19,500–₹21,000 | ₹4,000–₹5,500 |
| ₹10,000 | ₹50,000 | ₹39,000–₹42,000 | ₹8,000–₹11,000 |
| ₹15,000 | ₹75,000 | ₹58,500–₹63,000 | ₹12,000–₹16,500 |
| ₹25,000 | ₹1,25,000 | ₹97,500–₹1,05,000 | ₹20,000–₹27,500 |
Estimates based on average large-cap fund NAV erosion of 18–22% in CY26. Actual figures depend on your specific fund and entry dates.
And if you hold individual large-cap stocks that feature among the 15 hardest-hit names? The math is starker. A ₹1 lakh position in a stock down 40% is now ₹60,000. That's not a paper loss you can ignore at dinner. That's real purchasing power — a family holiday, six months of school fees, or two EMIs — gone from your net worth statement.
Your instinct right now might be to check whether you should exit. That instinct is worth examining — not because selling is wrong, but because the reason you're feeling it matters more than the action itself.
The Numbers Hiding in the Noise
Most coverage focuses on the index. Your portfolio doesn't live in the index — it lives in specific stocks and funds. Here's what the data actually shows at the stock level for CY26's worst large-cap performers:
- Declines of 35–40%: A cluster of large-caps in capital goods, select IT services, and consumption-facing sectors. These were among the most expensive names by P/E in late 2025.
- Declines of 28–34%: Financial sector heavyweights and a few pharma names where margin pressure combined with FII selling created a double compression — both earnings and valuations fell simultaneously.
- Declines of 25–27%: Infrastructure and metals names caught in the global commodity downdraft.
The pattern data reveals is this: the steepest crashes hit the stocks that were most expensive relative to earnings in December 2025. Market pricing implies that the re-rating wasn't random — it was a structured decompression of premium valuations. Stocks trading at 40–60x earnings a year ago are now trading at 24–35x. That's not a crash to 'cheap.' For many, it's a correction to 'fair.'
That distinction matters enormously for what you do next with your portfolio.
The Signal Your Portfolio Is Sending You
The conversation most salaried investors need to have right now isn't 'when will the market recover.' It's simpler and more personal: do you know what you actually own?
If your answer to that question is 'a large-cap fund' or 'a couple of blue-chips my broker suggested,' this is the moment to get specific. Pull up your mutual fund factsheet. Check the top 10 holdings. Cross-reference against the names in the news this week.
What you might find:
- Your 'diversified' large-cap fund has 30–35% concentrated in 4–5 names, some of which are among the year's worst performers.
- Your ELSS (locked in for 3 years) holds stocks that have fallen 30%+, and you have no exit option regardless of what the market does.
- Your direct stock picks, bought on tips or momentum in 2024–25, are now underwater — and your cost price feels uncomfortably far from current levels.
None of this means you should panic-sell. What it means is that your portfolio is currently sending you information. Whether you read that information or mute it is a choice only you can make — but it's a choice with a ₹ value attached to it either way.
Markets have historically rewarded those who used corrections to understand their holdings better, not just those who timed the bottom. The discipline of knowing why you own something is what separates investors who recover from those who don't.
What This Signals
When 15 of India's largest companies fall 25–40% in a single calendar year, it signals that the post-pandemic valuation premium built into Indian equities is undergoing a structural reset, not just a seasonal dip. For salaried investors, the implication is straightforward: portfolios built on momentum and brand name alone are now being priced on fundamentals — and the gap between the two is your current loss.
This content is informational only and should not be interpreted as a recommendation to buy, sell, or hold any security. Seek professional financial advice before acting on anything you read here.