Bitcoin ended March at roughly $67,600 — almost exactly where it started. The headline writes itself: crypto weathered the Iran conflict.
Don't buy it.
Beneath that placid price tag, the Bitcoin network lost more than 100 exahashes per second of computing power — the equivalent of roughly 12% of the entire network going dark in less than three weeks. The hashrate plunged to 937 EH/s from 1,086 EH/s in late February. For anyone holding a position — whether you're in New York, London, or Mumbai — the picture underneath is considerably more unsettling than the headline.
Snapshot
- BTC price (March close): ~$67,600 — flat vs. February close
- Hashrate peak (March 1): 1,086 EH/s → dropped to 937 EH/s by March 16
- Network difficulty adjustment: Down 7.7% to 133.79T from 145.04T
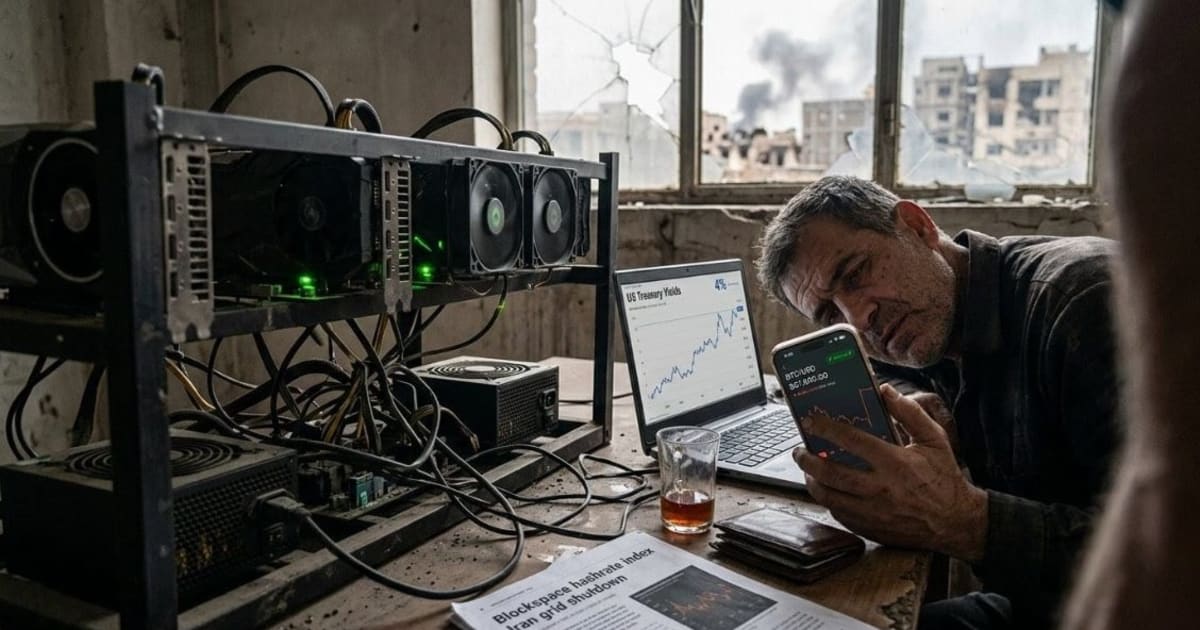
- 10-yr Treasury yield: 4.41% — highest since August; up 48 bps since Feb 28
- 2-yr Treasury yield: 3.94% — up 57 bps since the Iran conflict began
- HOOD stock (March performance): Down 16% this month; down 42% YTD
- Long liquidations (March 27 alone): $50M+ in a single hour
- Weekly liquidations (BTC): Over $1.3B in leveraged positions wiped out
Iran's Secret Mining Empire Went Dark
The month's story began February 28, when US and Israeli forces struck Iranian military and energy infrastructure. Within days, Iran's power grid was operating under emergency load-shedding protocols — and something few Western analysts had fully priced in became immediately visible in the data.
Iran had been mining Bitcoin at scale for years.
Estimates put Iran's peak share of global hashrate at 3–7% — a figure that had been quietly growing since the country legalized mining in 2019 as a sanctions-evasion tool. When the grid went dark, so did the rigs. As Blockspace co-host Colin Harper noted: "Bitcoin's hash rate typically is always marching upward — but we're seeing repeated downward adjustments, which just does not happen."
The last time the network saw sustained downward difficulty pressure like this was the 2021 China mining ban — which wiped roughly 50% of global hashrate overnight. This isn't that. But it rhymes.
Meanwhile, hashprice — the revenue a miner earns per unit of computing power — had already hit an all-time low of $27.89 per PH/s/day back in February, per Luxor's Hashrate Index. The network was stressed before the strikes. The conflict just made it visible.
Numbers vs Narrative
The mainstream read: Bitcoin proved resilience. The Iran conflict rattled energy markets, hashrate wobbled, but BTC stayed above $65,000. Robinhood's decline is cyclical — crypto trading volumes fell, sentiment soured, and the stock is a leveraged bet on crypto activity. The $1.5 billion buyback management announced March 24 signals leadership sees the dip as an opportunity.
What the data actually shows:
Bitcoin didn't hold flat because of strength. It held flat because two opposing forces — sell pressure from macro tightening and buy pressure from short liquidations — roughly cancelled each other out. That's not stability. That's a tug of war.
On March 27, Bitcoin fell below $67,000, triggering $50M+ in long liquidations in a single hour. Over the full week, more than $1.3 billion in leveraged positions were wiped out, even as BTC traded within a tight $66K–$72K band. The price looked calm. The underlying book was carnage.
The yield math nobody's running:
| Treasury benchmark | Rate (March end) | Change since Feb 28 |
|---|---|---|
| 10-year yield | 4.41% | Up 48 bps |
| 2-year yield | 3.94% | Up 57 bps |
| 5-year yield | Rising ~4% on month | Highest in months |
For a US household with a $400,000 variable-rate mortgage, each 50-basis-point rise in benchmark rates translates to roughly $1,600 more per year in debt service. That's money not flowing into ETFs, risk assets, or Robinhood accounts.
HOOD's story runs parallel: peaked at $153.86 over the past 12 months, now trades near $66 — a 57% drawdown from peak. Down 42% YTD, down 16% in March alone. Goldman Sachs cut its price target from $102 to $91. Loop Capital holds at $130. The $117 consensus target implies 78% upside from current levels. Someone is very wrong.
Levels That Matter
- $67,000 — intraday support that broke on March 27; retesting this level is now possible
- $64,000–$65,000 — structural demand zone; institutional limit orders concentrated here
- $72,000 — upper boundary of March's range; reclaiming this on volume is the first bullish signal
- $96,800 — the 200-day moving average; full technical recovery requires a ~40% move from current levels
- $54,000 — realized price; the level where average holder goes underwater
Only 57% of Bitcoin supply is currently in profit — a level historically associated with early bear markets, per CoinGecko data.
The Unresolved Question for April
Bitcoin started March flat. Whether April looks different depends entirely on one question: does the Federal Reserve cut, hold, or — and this is the scenario markets hadn't priced three weeks ago — hike?
CME FedWatch data from late March showed the probability of a rate hike at the April meeting rising to 12%, up from 0% just one week earlier. If oil holds above $100 and inflation data surprises to the upside, the rate-cut narrative that was supposed to lift crypto in 2026 doesn't just pause — it reverses entirely.
So here's what nobody's answered yet: if a single war knocked out an estimated 3–7% of global hashrate and pushed yield expectations sharply higher in the same month, what does the second-order pressure look like if that war extends through Q2? The halving cycle thesis doesn't disappear. But it needs a macro environment that's cooperating. Right now, the macro is doing the opposite.
Nothing in this article should be considered investment advice. The information presented is for educational purposes. Consult a licensed financial advisor before making any financial decisions.